Google added a second row to the report every SEO opens first. Since 24 September 2026, the Performance report in Google Search Console splits the web search type into two values: web: text-based and web: multimodal. The multimodal row counts searches where the query was an image rather than typed words — a Google Lens capture, a Circle to Search gesture on Android, an image uploaded to Google Search, or Chrome’s right-click “Search this image”.
The interesting part is not the filter. It is that Google’s own explanation of where the numbers came from was corrected inside a few hours of the announcement, and that at least one practitioner’s property-level data still does not match the corrected version.
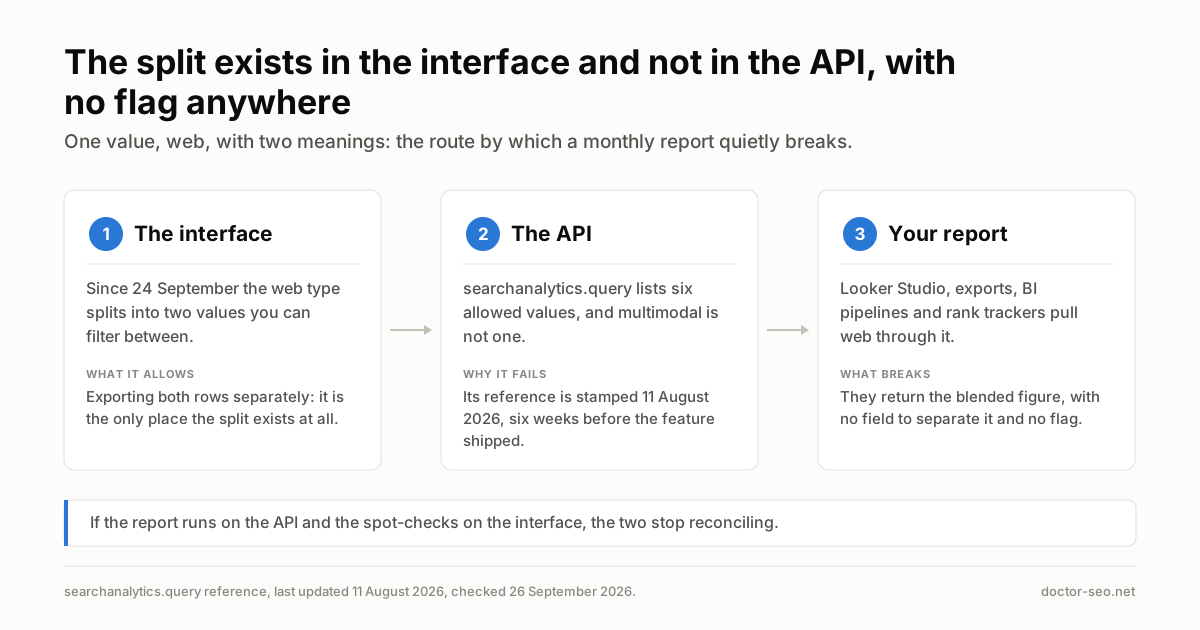
There is also a gap nobody at Google has commented on: the split exists in the Search Console interface and not in the Search Analytics API.
What Google said
Google Search Central published “Announcing web multimodal Search performance reporting in Search Console” on 24 September 2026. The post frames the change as visibility into a search behaviour that site owners could not previously isolate, offering “insights into how your content is surfaced when users search using images (such as with a smartphone camera)”.
Google stated the rollout is global and began that day: “The integration of multimodal search data is rolling out globally starting today.” No completion date was given, and availability is staggered across properties, so a property that shows no multimodal row today is not necessarily a property with no multimodal traffic.
Google disclosed no figure for how large multimodal traffic is — no share of web impressions, no benchmark by vertical, nothing. This is a documentation change, not a study, so no sample size applies to any of it, and any percentage circulating this week has no primary source behind it.
What the documentation actually says
Search Console’s Performance report help page now describes the filter as covering “web (text-based or multimodal), image, video, or news searches”, and defines the new value as: “Web: multimodal — Includes web search results where an image was used as part of the search.” The help page carries no published last-updated date, which matters when you are trying to establish what changed and when.
The important limitation is in the same documentation: “Because multimodal searches mostly use images rather than text, specific text query data isn’t available for this traffic.” The dimensions documentation is more explicit — “the queries dimension isn’t available when this search type is selected”.
So multimodal is measurable at page, country and device level, and not at query level. You can see which of your pages earn clicks from image-initiated searches. You cannot see what the image was, and you cannot reverse-engineer intent from a keyword, because there is no keyword.
The split appears in two places: the Performance report for Search results, and the separate performance report for generative AI features.
| Attribute | web: text-based | web: multimodal |
|---|---|---|
| Query trigger | Typed text | Image, photo or screenshot |
| Entry points | Standard search box | Lens, Circle to Search (Android), image upload, Chrome “Search this image” |
| Queries dimension | Available | Not available |
| Pages, countries, devices | Available | Available |
| In the Search Analytics API | Yes, as web |
No value exists (reference last updated 11 August 2026) |
What the community measured
Within hours of the announcement, the question that mattered was asked on Bluesky: is this new traffic, or traffic that was already in the web total and has now been separated out?
John Mueller of Google answered first with uncertainty — “I’ll double-check, I thought these were not reported at all before” — and then, in a post timestamped 24 September 2026 at 14:16 UTC, with a checked answer: “And … checking with the team, the data wasn’t previously in the counts, the report has new data.”
That answer has a consequence. If multimodal impressions were never in the web total, then from the rollout date onward the web total goes up without anything about the site changing. The uplift is a reporting artefact, and any year-on-year or month-on-month comparison that crosses the rollout date compares two different definitions of the same metric.
But the practitioner data does not sit comfortably with it. Dave Smart, quoted by Barry Schwartz at Search Engine Roundtable on 24 September 2026, asked whether the impressions had been grouped under web all along and reported the opposite pattern: “I am seeing corresponding drops in impressions and clicks starting the 10th on a few properties, which lines up with the new data.” Drops starting 10 September, two weeks before the announcement, are what you would expect if impressions were being moved out of the text-based bucket, not added to a total.
That observation is a single practitioner looking at “a few properties”. No property count, no impression volumes and no site names were published, so it is a signal to check against your own data, not a finding. Nobody has published a paired before-and-after series with the properties disclosed, which is the measurement that would settle it.
The gap between the interface and the API
Here is the part with no disagreement attached to it, because it is checkable in thirty seconds. The Search Analytics API reference for searchanalytics.query lists six allowed values for the search type parameter: discover, googleNews, news, image, video and web. The word “multimodal” does not appear on the page. Its last-updated stamp reads 11 August 2026 — six weeks before the feature shipped. Verified against the live reference on 26 September 2026.
The practical effect is that Search Console’s interface and its API now disagree about what web means. In the interface it is a parent with two children you can filter between; in the API it is one undifferentiated number. Every Looker Studio dashboard, scheduled export, BI pipeline and rank tracker that pulls web performance through the API returns the blended figure, with no field to separate it and no flag saying the composition changed.
If your monthly report is built on the API and your spot-checks are done in the interface, the two will stop reconciling, and the interface is the one that can explain itself.
What this changes in practice
For most sites this is a measurement change rather than a traffic change. Nothing about how Google ranks pages moved on 24 September 2026. What moved is the boundary of a metric that a great many SEO decisions are dated against.
Three practical consequences. First, any impressions or clicks comparison that spans 24 September 2026 now crosses a definition change, and needs an annotation before someone reads a step in the chart as a win. Second, pages that rank on visual similarity — product photos, plants, parts, landmarks, packaging, interface screenshots — may show a page-level profile no keyword report explains, and that is expected rather than broken. Third, image optimisation stops being purely an image-search argument: the target surface is now a web result reached through a camera.
The analytics and measurement level of the course covers how to date a reporting change so that later analysis does not read it as performance, which is the discipline this week actually requires. The technical SEO level covers the crawling and indexing side of image assets, and the GEO and AIO level covers how the generative AI performance report fits beside the classic one.
What to do this week
- Check whether the row exists yet. Performance report → Search results → search type filter. Staggered rollout means absence today proves nothing.
- Export both rows separately for the last 16 months while you are in the interface, so you hold a baseline that the API cannot give you.
- Annotate 24 September 2026 in every dashboard that charts web impressions or clicks, and annotate 10 September 2026 as an unexplained secondary boundary if your own data shows a step there.
- Check your API-fed reports for a silent mismatch. Pull
webfor a single day through the API and compare it with the interface total for the same day. Record the result — that comparison is the only evidence you will have about your own property. - Do not rebuild a keyword strategy on this. There are no queries in this data, by design.
- Identify your five pages with the highest multimodal clicks and look at what is actually photographable on them. That is the closest thing to intent this report offers.
Where the industry genuinely disagrees
One question here is unresolved, and this site is not going to pretend otherwise.
Is a newly reported Search Console dimension new data, or a reclassification of data already counted? Google’s position, given by Mueller after checking with the team, is that the data was not previously in the counts. The strongest argument for it is simple: the person answering asked the team that owns the pipeline, and no one is better placed to know.
The strongest argument on the other side is Dave Smart’s observation of corresponding drops from 10 September on several properties — which is the pattern reclassification produces and the pattern net-new data does not. It is also possible both are true of different things: a pipeline can start collecting a new signal on one date and start displaying it on another, with an unrelated change causing the September dip.
What the available evidence cannot settle: nobody has published property-level impression series across both dates with the properties disclosed, and Google has published no note about a data-collection start date. Until one of those exists, the honest position is that the direction of the change in your own web total is an empirical question about your own property, and you should answer it from your own export rather than from anyone’s statement.
What is still unknown
Whether the API will gain a multimodal value, and when. Whether the historical data extends back before 24 September 2026 or begins there. Whether the 10 September step several properties show is related to this at all. How large multimodal traffic is as a share of web impressions, in any vertical — Google has published no figure.
Author’s opinion — Txema Hermoso
This section is opinion, not reporting. Everything above is sourced; what follows is my read.
The useful part of this release is not the new visibility. It is the reminder that the metric most SEO reporting is built on is a definition Google can change without a changelog entry on the help page. Search Console is a product, not an instrument.
My practical position is that the interface–API mismatch is the bigger operational problem this week, and the one nobody is discussing. A wrong number in a monthly report leadership trusts does more damage than an unexplained step in a chart an SEO sees daily.
On whether the numbers are new or moved, I hold no position and the evidence licenses none. I would rather tell a client “I am checking our own export against both dates” than repeat either camp’s confident version. That is also why the annotation matters more than the answer: an annotated discontinuity is recoverable later, and an unannotated one quietly corrupts every comparison built on top of it.
Sources
- Announcing web multimodal Search performance reporting in Search Console — Google Search Central Blog, 24 September 2026.
- Performance report (Search results) — Search Console Help. No published last-updated date.
- Search Analytics API: searchanalytics.query — Google for Developers, reference last updated 11 August 2026. Checked 26 September 2026: no multimodal value.
- John Mueller on Bluesky, 24 September 2026, 14:16 UTC.
- Multimodal Search Type Filter In Google Search Console Performance Report — Barry Schwartz, Search Engine Roundtable, 24 September 2026, including Dave Smart’s observation.
- Google Search Console gains Lens and Circle to Search data, without queries — Luis Rijo, PPC Land, 24 September 2026.
- Google Search Console Adds Multimodal Filter For Image-Based Searches — Matt G. Southern, Search Engine Journal, 24 September 2026.
No statistic in this article comes from a study: every figure above is a date, a documented value or a single practitioner observation, and no sample size applies to any of them.