Google has numbers for how long its own pipeline takes, and on 2 October 2026 it read some of them out loud. Gary Illyes, an analyst at Google, presented a set of typical and worst-case durations for crawling, indexing and serving at Search Central Live Deep Dive Europe in Barcelona. A new URL is typically discovered in about 20 hours. A URL Google already knows is typically refreshed in about 30 days.
The surprising figure is not the 20 hours. It is the 30 days, which says the slow part of getting a change seen is almost never the discovery of a brand-new page.
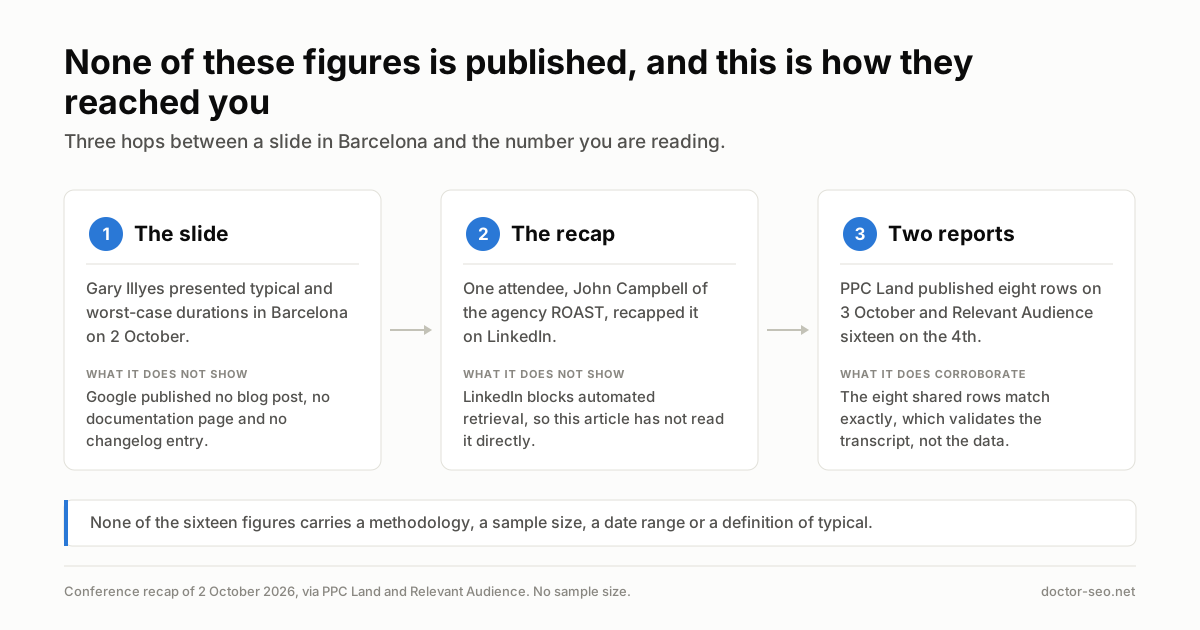
Google has published none of these figures: no Search Central blog post, no documentation page, no changelog entry. They reached the industry through a conference recap — and the one row a dated Google document corroborates at the same magnitude is the least interesting row on the slide.
What was presented, and how it reached this article
The talk was given by Gary Illyes at Search Central Live Deep Dive Europe, held in Barcelona from 30 September to 2 October 2026. The timings were recapped by John Campbell, Head of Innovation and AI at the agency ROAST, who attended. Campbell’s recap was published on LinkedIn, which blocks automated retrieval, so this article could not read the recap directly and does not claim to have.
Two independent reports carry the figures. Luis Rijo at PPC Land published eight rows on 3 October 2026. Relevant Audience published sixteen rows on 4 October 2026. The eight rows that appear in both are identical in both, which corroborates the rendering of the recap — not the data behind it.
No methodology, no sample size, no date range and no definition of “typical” was disclosed with any figure. Relevant Audience puts it plainly: treat them “as an attendee’s account of a conference slide, not as a service-level promise”.
The sixteen timings as reported
These are the durations as rendered by the two reports named above. They describe Google’s pipeline, not any individual site, and none carries a sample size.
| Stage | Typical | Slowest |
|---|---|---|
| Discovery of a new URL | ~20 hours | Weeks to never |
| Refresh of a known URL | ~30 days | Weeks to never |
| Sitemap processing | ~24 hours | Up to 14 days, or never (quality) |
| Crawl capacity change | 4 hours to 1–2 weeks | 1–3 weeks (recovery) |
| Crawl demand change | ~20 hours | Weeks to months |
| robots.txt change | ~24 hours | 25 hours |
| Indexing, end to end | ~1.5 hours | Months, or never (quality) |
| Canonicalisation change | 1–3 weeks | Months (conflicting signals) |
| Site move | 1–3 months | 6 months to 1 year or more |
| Removal | 1–3 weeks | Months |
| Structured data update | Hours to 1–2 weeks | Weeks, or never |
| Removal via Search Console tool | ~2 hours | 24 hours |
| Snippet or title change | 1–2 days | Weeks to months |
| Manual action removal | 1–2 weeks | 4–6 weeks, longer for dormant sites |
| Core update recovery | 3–6 months | 6 months to 1 year |
| Spam update change | 1–2 weeks | Months |
What a dated Google document actually corroborates
Six Google sources were read live on 4 October 2026 to see which of the sixteen rows exist anywhere in Google’s published record. The answer: one at the same magnitude, one at a different magnitude, two qualitatively, twelve not at all.
| Google source | Last updated | What it contains |
|---|---|---|
| Large site owner’s guide to managing crawl budget | 2026-07-22 UTC | No discovery figure and no refresh figure. Google’s own document about crawling does not contain the two headline numbers. |
| robots.txt introduction and guide | 2026-08-31 UTC | “Google generally caches the contents of robots.txt file for up to 24 hours.” Matches the recap’s ~24 hours. |
| Site moves with URL changes | 2026-08-20 UTC | “for medium-sized websites, it can take a few weeks or more.” Faster than the recap’s 1–3 months typical. |
| Google Search core updates and your website | 2025-12-10 UTC | “it could take several months”, and if nothing changes “that could mean waiting until the next core update”. No 3–6 month figure. |
| Search Central documentation changelog | Read 4 Oct 2026 | One October 2026 entry, dated 1 October, about generative AI content. Nothing about crawling timings, indexing timings or Barcelona. |
| Search Status Dashboard | Read 4 Oct 2026 | September 2026 spam update, begin 2026-09-24T16:15:00+00:00, no end timestamp, “may take up to two weeks to complete”. |
The site-move row is worth pausing on. Google’s documented guidance for a small to medium site is “a few weeks or more”; the recap’s typical figure is 1–3 months. A migration plan built on the published document is more optimistic than the slide.
The spam-update arithmetic, as of today
One row connects directly to a live event. The September 2026 spam update has a begin timestamp of 2026-09-24T16:15:00+00:00 on Google’s Search Status Dashboard, and when the dashboard was read on 4 October 2026 it still carried no end timestamp. That is day 10 of a window Google described as “may take up to two weeks to complete”.
The recap’s spam-update row says a change typically shows in 1–2 weeks and at worst in months. Both numbers point past the dashboard window rather than inside it, and neither tells a site owner whether their own traffic movement belongs to this update.
What to do this week
These figures change what counts as a problem, which is their practical value.
- Stop diagnosing a publishing problem at 24 hours. If a new page is not indexed a day after publication, the reported typical discovery time has barely elapsed. Set the internal escalation threshold at a week, not a day.
- Treat updated pages as the real latency problem. A ~30 day typical refresh means a price change, a disclaimer or a corrected statistic on an existing page can sit unseen for a month. If a change must be seen quickly, the lever is internal linking and sitemap
lastmodaccuracy, not patience. - Re-date your migration plan. If the plan was written against Google’s documented “a few weeks or more”, run the schedule again at 1–3 months and check what breaks — contract end dates, redirect retention, reporting comparisons.
- Measure your own site rather than adopting the number. Record the gap between publication and first crawl for 20 recent URLs and keep the median. Your own figure is first-party, dated and citable; Google’s is none of those for your property.
The last point is the one that compounds. The analytics and measurement level of the course covers building that record from Search Console, and the technical SEO level covers the crawl and indexing mechanics these timings sit on top of. If the pipeline itself is unfamiliar, how Google works is the shorter route in.
Where the industry genuinely disagrees
Two questions behind this story are unsettled, and nothing in the evidence above settles either. Doctor SEO reports them rather than ruling on them.
Whether a conference figure is evidence about Google’s systems. One camp holds that conference talks are where Google discloses operational detail it will never write down, that Gary Illyes is among the few people who can state these numbers accurately, and that refusing the data means practitioners work with no numbers at all. The other camp holds that an unpublished slide relayed through one attendee cannot be re-read, re-checked or compared against a previous version; that no methodology, sample size, date range or definition of “typical” accompanies any figure; and that a number nobody can retrieve is not a measurement. Nobody can settle it, because Google publishes neither its conference slides nor any mapping from a stated figure to a documented one.
Where the boundary of an update goes. The spam-update row and the open dashboard window invite a site owner to date their own traffic movement to this update. One camp treats the dashboard timestamps as the only reproducible boundary; the other treats them as a publication date rather than a serving date. No published study pairs third-party volatility readings against confirmed rollout windows with sample sizes disclosed, so both argue from the same absence of data.
What Txema Hermoso thinks
This section is opinion, not reporting. The sections above are what the sources say; this is what I make of it.
The useful thing is not any single duration. It is that the shape of the pipeline is now public: discovery fast, indexing fast, refresh slow, recovery slower by an order of magnitude. That ordering matches what I see in client accounts, and it reframes most “Google hasn’t indexed my page” tickets as “Google hasn’t re-read my page” — a different problem with different fixes.
What I will not do is treat 20 hours or 30 days as a benchmark for anyone’s site. The figures carry no sample size and no definition of “typical”, and a median across Google’s entire crawl surface says little about a 200-page business site with a thin link profile. Nor will I say the conference figures are more or less reliable than Google’s documentation: that is the open question above, and it is not mine to close.
The one claim I will defend is the documentary one, because anyone can reproduce it: of sixteen reported rows, one is corroborated at the same magnitude by a dated Google page, one is contradicted in magnitude by a dated Google page, two are documented only qualitatively, and the two headline crawl figures appear in no Google document at all — including the guide Google wrote about crawling.
What is still unknown
Four things, and they are why none of this becomes a forecast.
- Whether “typical” means a median, a mean or a modal band. No definition was disclosed, so the figures cannot be compared against anyone’s own distribution.
- What population the figures describe. No sample size, no date range and no site-size segmentation. A number drawn from the whole web behaves differently on a small site.
- Whether Google will publish them. The documentation changelog carried one October 2026 entry when read on 4 October, and it was about generative AI content.
- Whether the figures are current. The core-update page dates from 2025-12-10 UTC and the crawl-budget guide from 2026-07-22 UTC; an undated slide cannot be placed relative to either.
The short version
- Gary Illyes presented Google’s internal crawling, indexing and serving timings at Search Central Live Deep Dive Europe in Barcelona on 2 October 2026.
- Typical figures as reported: new URL discovered in ~20 hours, known URL refreshed in ~30 days, end-to-end indexing ~1.5 hours, site move 1–3 months, core update recovery 3–6 months, spam update change 1–2 weeks.
- Google has published none of them. The figures reached the industry through one attendee’s recap, rendered identically by two independent reports.
- No methodology, sample size, date range or definition of “typical” was disclosed with any figure.
- Of sixteen rows, one matches a dated Google document in magnitude (robots.txt, ~24 hours), one is slower than a dated Google document (site moves), two are documented qualitatively, and twelve appear nowhere in Google’s published record.
- The September 2026 spam update began 2026-09-24T16:15:00+00:00 and still had no end timestamp when checked on 4 October 2026 — day 10 of a stated two-week window.
- The actionable move is to measure your own publication-to-crawl gap rather than adopt a figure drawn from the whole web.
Frequently asked questions
Did Google officially announce these timings?
No. The figures were presented in a conference talk by Gary Illyes on 2 October 2026 and reached the industry through an attendee’s recap. As of 4 October 2026 they appear in no Search Central blog post, no documentation page and no changelog entry.
Does ~20 hours mean my new page will be indexed tomorrow?
No. The ~20 hours figure describes discovery of a new URL, not indexing, and it is a typical value across Google’s crawl surface with no sample size disclosed. The reported slowest case for discovery is “weeks to never”.
Can I use the 3–6 month core update recovery figure in a client report?
Only with its provenance attached. It is an unpublished conference figure with no sample size, and Google’s own core updates page, last updated 2025-12-10 UTC, says “several months” without a range. Reporting the range as Google’s published guidance would misstate the record.
Sources
- Luis Rijo, “Google says new pages take about 20 hours to be found, some never are”, PPC Land, 3 October 2026 — eight timing rows from John Campbell’s recap of Gary Illyes’s 2 October 2026 talk.
- “Illyes timings: 20 hours to find a new URL (recap)”, Relevant Audience, 4 October 2026 — all sixteen timing rows from the same recap.
- John Campbell (ROAST), recap of Search Central Live Deep Dive Europe, published on LinkedIn, 2–3 October 2026 — the origin of the figures. Not fetchable in this environment; LinkedIn blocks automated retrieval, so the figures are carried here through the two reports above.
- Large site owner’s guide to managing crawl budget, Google Search Central, Last updated 2026-07-22 UTC, read 4 October 2026.
- robots.txt introduction and guide, Google Search Central, Last updated 2026-08-31 UTC, read 4 October 2026.
- Site moves with URL changes, Google Search Central, Last updated 2026-08-20 UTC, read 4 October 2026.
- Google Search core updates and your website, Last updated 2025-12-10 UTC, read 4 October 2026.
- Search Central documentation changelog, read 4 October 2026 — one October 2026 entry, dated 1 October.
- Google Search Status Dashboard, incident record read 4 October 2026 — September 2026 spam update, begin 2026-09-24T16:15:00+00:00, no end timestamp.
- Search Central Live Deep Dive Europe 2026: Meet the community speakers, Google Search Central, 16 September 2026 — confirms the event ran 30 September to 2 October 2026 in Barcelona.