On 17 November 2026 SparkToro published a study of 41,961 ChatGPT conversations that does something the AI-search commentary of the last two years has mostly avoided: it puts a number on how much of ChatGPT use is commercial, names the panel the number came from, publishes the date range, and then spends a whole section on what the panel cannot see.
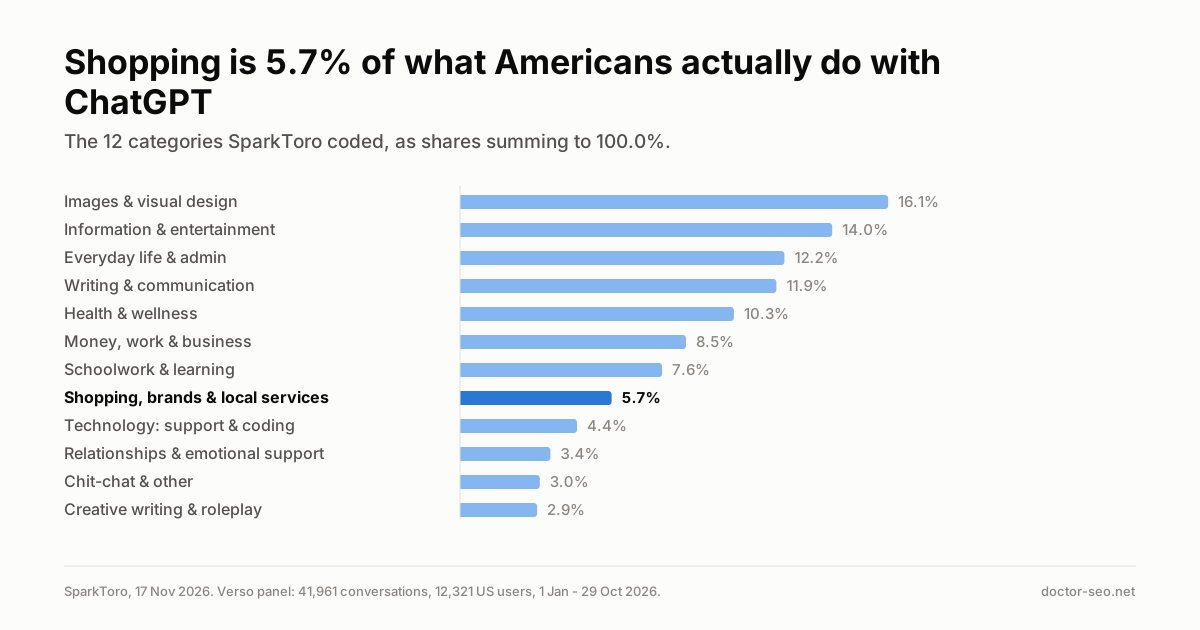
The figure that matters to anyone who sells something is small. “Shopping, brands & local services” accounts for 5.7% of American ChatGPT use — eighth of twelve categories, below health, below schoolwork, below everyday admin.
The figure that complicates it is that the same post reports the commercial share twice, in two different units, and reconciles the two nowhere on the page. That gap is the most useful thing in the study, and it is the part the trade coverage has dropped.
What SparkToro measured
SparkToro is the audience-research company run by Rand Fishkin, and the data behind this study came from Verso, which makes what the post calls “opt-in, anonymized connections to OpenAI”. The dataset is 118,163 prompts across 41,961 anonymized, complete ChatGPT conversations from 12,321 panel users, between 1 January and 29 October 2026, all in the United States.
Every conversation was given exactly one label from a codebook of 34 fine-grained intents grouped into twelve top-level categories. Those twelve categories, as per-user shares, sum to 100.0%.
Read the ordering rather than the headline. The top three — images and visual design at 16.1%, information and entertainment at 14.0%, everyday life and admin at 12.2% — are 42.3% of use between them, and none is a search behaviour an SEO would recognise. The single largest thing Americans do with ChatGPT, in this panel, is make pictures.
The methodology, which is better than the industry norm
SparkToro published more method than almost any AI-usage figure in circulation, and the detail is what makes the study quotable. The disclosures that matter:
| What was disclosed | What the post says |
|---|---|
| Data source | Verso, an opt-in panel of US ChatGPT users who consented to share chat history |
| Sample | 41,961 conversations, 118,163 prompts, 12,321 users |
| Date range | 1 January to 29 October 2026 |
| Classification | A codebook of 34 intents in 12 categories; every conversation labelled by an AI model, and the post states “Labels were not assigned by keyword rules” |
| Agreement check | A second, independent labeller re-coded a random sample. The two “agreed on 90% of category labels (κ ≈ 0.88) and on 97–99% of the brand tags” |
| Weighting | The 9,675 panelists with demographic records were weighted to 2024 US Census targets for age, gender, region, education and household income. “No category moved by more than 1.4 percentage points” |
| Exclusions | 131 heavy users, about 1% of panelists, who sent 21% of all prompts |
| Stated limits | The panel “skews younger, female, and lower-income”; it was recorded mostly on phones, so desktop and work-account use is underrepresented; API traffic is missing entirely |
| Margin of error | None published. The words “margin of error” and “confidence interval” do not appear on the page |
The last row matters: a κ of 0.88 is an inter-coder agreement statistic, not a sampling error, and the two get confused by people quoting studies like this one. SparkToro publishes the first and not the second.
Fishkin is explicit about the largest hole. The panel “tells us what people ask ChatGPT far better than how much they use it”, because API requests are invisible to it — and his estimate of how much that hides is “50-75% of all usage”, offered as a guess rather than a measurement.
The two commercial numbers that do not agree
This is a criticism of a specific page rather than of SparkToro generally. The post gives two different figures for how much of ChatGPT use is commercial, and never puts them side by side.
In the section headed “What percent of conversations have purchase intent?”, the post says: “Only 6.9% of prompts showed anything related to researching a potential brand to buy from.” In the “Rand’s Takeaways” list near the end, item three says: “That said, 12% of ChatGPT usage is part of the buyer journey.”
Those are not the same claim. One is a share of prompts, the other of usage; one is scoped to researching a brand to buy from, the other to the whole buyer journey. Verified on two independent reads on 20 November 2026, the post contains no sentence reconciling them and no explanation of which definition the 12% uses. The purchase-intent section defines three groups — no purchase intent, researching options, and analysing a single brand — without saying which of those the 12% adds together.
A third number sits nearby and is different again: 12.1% of responses contained one or more brands, products or companies. That is a property of ChatGPT’s answers, not of users’ intent, and it is the figure most likely to be mistaken for the other two because it is numerically almost identical to one of them.
The practical consequence is simple. If you are about to quote a commercial-share number for ChatGPT, say which of the three you mean and in what unit, because the source itself does not.
The Google comparison, and the arithmetic the post does not show
SparkToro sets the ChatGPT figure against its own earlier work on Google: “For comparison, when we looked at 332 million Google queries two years ago, 15%+ matched this definition.” So on the post’s own two numbers, the commercial share of Google queries is roughly twice that of ChatGPT prompts.
The post then states the gap as larger than that. It says Google is “~2.8X bigger (probably more) in the percent of searches with purchase intent”, and that “Conservatively, I’d guess that people ask Google purchase-journey-related queries at 16X+ the rate of ChatGPT.”
Dividing the two published figures gives about 2.2, not 2.8. The gap may be entirely accounted for by the fact that 15%+ is a floor rather than a point estimate, and by the Google study being two years older with a definition that may not match — but the post shows no calculation for either ratio, and the 16X figure is explicitly flagged by its author as a guess. Treat the 5.7% and the 6.9% as the study’s findings, and the multipliers as commentary on them.
What this changes in practice
Less than the headline suggests, and in a specific direction. A 5.7% shopping share is a statement about composition, not volume: it says what the slice is made of, not how many people are in it. A small share of a large product can still be a meaningful number of buyers, and the study deliberately does not size that, because its author says the panel cannot measure usage volume.
What it does support is a reweighting of effort. If roughly nine in ten ChatGPT conversations are not commercial at all, then tooling that reports your brand’s share of a prompt set is measuring a narrow slice of the surface, and treating that share as a proxy for demand is a category error. Our lesson on why every chatbot invents search volumes covers the same failure in its purest form.
What to do this week
- Write down which of the three numbers you have been quoting — 5.7% of use, 6.9% of prompts, or 12.1% of responses — and fix the unit in whatever deck or report it appears in.
- Separate AI referral sessions from AI visibility share in your reporting. They answer different questions and move independently; keeping them in one chart is how a citation-share rise gets presented as demand.
- Export a dated baseline of your AI-feature impressions now, so that whatever you conclude in six months has a starting point you did not reconstruct. The analytics and measurement level of the course has the method.
- Check whether your category is in the 5.7% at all. A B2B software vendor and a local plumber are both “commercial” and almost certainly have different shares inside a category this coarse.
- Stop paying for prompt-set visibility reports that publish no prompt set. A visibility percentage is relative to a sample somebody chose, and if that sample is undisclosed the percentage is not a population statistic.
Where the industry genuinely disagrees
This study lands on an argument this blog does not consider settled, and it is not going to settle it here.
Can an opt-in consumer panel tell you what share of commercial search behaviour has moved to AI assistants? One camp says yes, within its stated limits: 41,961 complete conversations is a large sample for this field, the weighting moved no category by more than 1.4 points, the classification agreement was independently checked, and a study that publishes its own holes beats a vendor chart that publishes none. The other says the instrument sees one slice of one product — consumer, mobile, non-API, opt-in — and that the missing slices are exactly where commercial and professional use would concentrate, so a composition figure drawn from it cannot be read as a population share. Nobody has published a panel that includes API traffic, or a paired consumer-and-desktop measurement, so both camps are reasoning from the same single dataset.
Related and equally unsettled on this site: whether platform-internal substitution data transfers across products, whether forced-adoption experiments generalise to gradual adoption, and whether a modelled volume figure is a measurement or an estimate presented as a count. Our GEO and AIO level flags each of these as open rather than resolving them.
What I think — Txema Hermoso
This section is opinion and the reporting above is not.
The most valuable number here is not 5.7%. It is that a carefully coded study, by someone with every incentive to produce a clean headline, shipped two unreconciled commercial-share figures in one post. That is not a scandal; it is what honest measurement looks like when nobody pretends it is tidy. Studies that come back with one clean number usually measured less.
The composition finding is also being read backwards. “Only 5.7% is shopping” is passed around as evidence that AI search does not matter commercially. It is evidence of something narrower and more useful: the commercial slice is small enough that a visibility score over an arbitrary prompt set is nearly meaningless as a demand signal. Those are different claims, and the second is actionable this week while the first is a slogan.
What I am not going to tell you is whether to reallocate budget away from AI visibility work. The study does not measure volume, its author says so in print, and I am not going to convert a composition percentage into a budget recommendation that the data cannot carry.
What is still unknown
- How much usage the panel misses. Fishkin’s “50-75%” for API traffic is his own estimate and is labelled as one. No published figure exists.
- Whether the 12% and the 6.9% describe the same population. The post does not say, and no correction had been issued at the time of writing.
- What the shopping share looks like by category or by basket size. The twelve-category breakdown is too coarse to tell a local service from a considered purchase.
- Whether any of this is moving. The data covers ten months as a single block; the post publishes no trend line across it.
- How often ChatGPT links out. The post contains no figure for how often responses cite or link to a website — verified on two reads. The 12.1% brand-mention figure is not that number.
Sources
- SparkToro, “We Analyzed 118,000 ChatGPT Prompts from 12,000+ Users to Answer: How Do Americans Use AI Tools in 2026?”, Rand Fishkin, 17 November 2026. Read twice by independent agents on 20 November 2026; every quotation above is from that page.
- Verso, the panel provider named in the study. No independent audit of the panel exists.
- Google Search Status Dashboard, incidents feed, checked 20 November 2026: the November 2026 core update that began 2026-11-10 is still the only incident with no end timestamp. No claim in this post is attributed to it.